
Tuesday, June 28, 2011
Housing Market
Friday, September 3, 2010
S&P500 vs. 30 Year Treasury Note

However, after intial widening today the 30 Year is coming back in (meaning yields decrease and prices increase--sorry for the lingo) while the S&P continues to rally. I hope the 30 Year is the
one that's right b/c I'm long both it and VXX.
Jobs data and ISM
Nonfarm payrolls today were down 54K vs. 131K last month and vs. 105K that was expected.
The thing is that last month the Bureau of Labor Statistics’ Birth-Death Model (that adjusts for seasonal factors of businesses being created or going bankrupt) added 6K to the number. Stripping that out gives 125K lost in July. This month the Birth Death Model added 115K. Stripping that out we lost 169 jobs. While an adjustment is obviously warranted in some way I am not sure that this number is as positive as the market sees it.
The ISM employment data supports this. Employment dipped below 50 from 50.9 to 48.2, meaning that employment is shrinking as opposed to expanding although this number has hovered around 50 all year. Export orders are also shrinking dipping below 50 to 46.5 (vs. 52 in July.) Here are all the changes:

So only three components actually improved. The biggest improvement was in prices paid. While this might signal that disinflation is not much of an issue it also squeezes profit margins. Imports are up, which I see mostly an artifact not of strong domestic demand but rather of the strong dollar.
The most important numbers on the weaker side in my view are new orders, down strongly from 56.7 to 52.4, the lowest read all year and Business activity, which is also down to the lowest read since January. Backlog of orders, Supplier delivers, and employment as I mentioned above are also discouraging. The 30 Year came in about 4 points on this.
But, as always, it doesn’t pay to fight the tape.
Tuesday, June 1, 2010
Unemployment in Euroland
This morning the unemployment number for the aggregate Eurozone came in. 10.1%. It kinda shocked me b/c I remember looking at German unemployment a while back and thinking: Wow, that's a low price, errr, I mean, that's pretty low.
So when this number came in I wanted to see how German unemployment compares to Eurozone unemployment as a whole. The spread graph is below.

a) there will be structural adjustments likely in "peripheral Europe" (i.e. the PIIGS.)
b) the falling Euro supports net exporters, benefiting countries like Germany and hurting countries like Greece or Spain.
c) in the other direction, how will labor mobility affect this as workers move from high-unemployment areas to low-unemployment areas.
Wednesday, May 19, 2010
More Thailand
Apparently, Thai armed forces have leveled the protester camp and a curfew has been put in place with violence escalating in the aftermath. The BBC has this.
Here are also some close-range pictures of what by now looks like civil war in Bangkok
Surprisingly, Thai equity markets have actually held up (in USD terms):

The possible good news that may come of this is that Red Shirt leaders have asked protesters to "go home." While I do think that their concerns need to be heard and while I support their right to force government to listen to them if the democratic process fails them, I do want the violence to stop. The downside is that there are multiple equilibria into which the situation could diverge:
a) protesters lay down arms and government and protesters come to the table.
b) protesters lay down arm, "go home" and are marginalized. Problems fester and re-erupt in a few months'/years' time.
c) without a leadership protesters split into violent factions and violence increases.
Here's a theory of why financial markets' interests can be anathema to peace. Short-term traders are interested in volatility. If Thai equity markets crap out--especially if it is on risk aversion while the fundamentals of the Thai economy remain intact--that provides a good buying opportunity, only to sell stocks when political tension has settled. You can see from the above graph that at least there is potential for Thai equities to reach 55 USD (this is the ETF that seeks to replicate the MSCI Thailand Index). The recent dip as a result of violence was a welcome buying opportunity. I would not be surprised if some traders were to hope for outcome b) above so they can sell and buy another dip in markets.
No Plan B for the European Currency Union
Today Secretary Geithner was on CNBC (which, as you probably know, I think is, in general, idiocy squared) and Erin Burnett interviewed him regarding the prospects of the Euro.
MS. BURNETT: And do you have a plan if it falls apart, I mean,
Paul Volcker again today was saying he thinks that there are some real
risks to the European Union as a concept and others, perhaps, even to
the Euro itself? I know you're a believer that Europe will stay
together. But are you working on a contingency plan in case there is
a dissolution of the Euro?
SEC. GEITHNER: Again, I'll say what I said before, absolutely
Europe has the capacity to manage through this. They made a decision
to do it and I believe they have the capacity to do that. Obviously,
they're going through their challenges, but they can manage those
challenges.
Michael Mussa, former chief economist at the IMF, in his book “Argentina and the Fund” makes the argument that one reason why Argentina was such a shitshow was b/c there was never a plan B considered, an orderly exit from the currency board. So if what Geithner says is true and not just to calm markets while behind the scenes IMF and European Commission are working hard to formulate an exit strategy for Greece and others in their position, then that could be very bad news if the ECU does find itself in a tight spot and needs to break up.
Tuesday, May 18, 2010
Thailand
The Atlantic Monthly has this on Thailand:
"Inside the Red-Shirt Camps The Atlantic's Jessica Olien relates, "When I first went into the camp, I was surprised by the orderliness and the industriousness of the people inside, who'd set up shops to sell food and red-themed merchandise, pharmacies, and even a massage parlor within the tent city. But the area still resembles a refugee camp: dwellings made of plastic sheets and bamboo; garbage strewn across the ground; the smell of rotting food and unwashed bodies permeate the air. Conditions will only get worse, assuming the government shuts off the water and cuts off supplies after the Thursday deadline."
A massage parlor.... omg, I love Thailand so much! I hope the violence stops soon.
Friday, November 6, 2009
Unemployment by Education
It would be interesting to see where GDP comes from, how much of GDP is produced by which educational stratum. The reason why it's interesting is that people with high school but no college, the lowest stratum measured, have, not surprisingly, shouldered most of the surge in unemployment. The gap in unemployment between people with a bachelor's or higher and people with only high school has increased pretty much in the same shape as the level in unemployment for people with only highschool as increased (see the two green lines in the figure below--click on it to see the graph better.) Unemployment for people with a bachelor's degree has actually declined in October.
So if people with a bachelor's or higher account for a disproportionate share of growth this could actually be good news.


Thursday, November 5, 2009
Productivity again
The market loved the productivity number today. It's not clear how the 9% number comes out of the eight inputs (presumably by some weighting and then forming the appropriate ratios) but it's clear that the output per hour number looks very good:
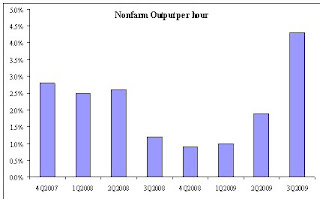

However, the data show that Output per hour only increased so much because while both output and hours worked declined, hours worked declined even more.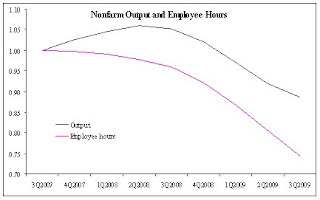 Production shows the by now classic green shoots phenomenon: Sure, it's declining, but it's declining at a slower pace.
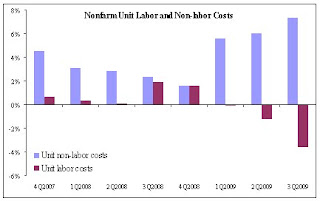
We can also see that we're not really cutting costs by that much more, depending on the capital to labor mix in the production function. While labor costs are falling, non-labor costs are rising even faster.
 It seems too easy an explanation that market participants don't look into these numbers and only look at the headline number but to me this is not reason to shrug off e.g. the CIT bankruptcy and believe the economy is humming along now. Production is still slowing and people work less, which does not spell well for future demand. Is a weak dollar really enough to sustain production and turn it around?
 Production shows the by now classic green shoots phenomenon: Sure, it's declining, but it's declining at a slower pace.
 We can also see that we're not really cutting costs by that much more, depending on the capital to labor mix in the production function. While labor costs are falling, non-labor costs are rising even faster.
 It seems too easy an explanation that market participants don't look into these numbers and only look at the headline number but to me this is not reason to shrug off e.g. the CIT bankruptcy and believe the economy is humming along now. Production is still slowing and people work less, which does not spell well for future demand. Is a weak dollar really enough to sustain production and turn it around?
Is greater productivity really good news?
This morning the Dept. of Labor released its productivity numbers. Productivity was up 9.5% after it was up 6.6% last quarter. Output per hour was up 4.3% while output was down but hours worked was down even more and a shift has happened from labor-intensive processes to capital-intensive processes as evidenced by falling unit labor costs and quickly rising unit non-labor costs. The market took it well and rallied on the productivity number. Apparently the economy can keep (or get back to) humming even with high unemployment. But firms only want to produce if there is demand for goods.
- why keep producing more if unemployment is high and demand is lacking?
- In this environment, where can we see demand coming from?
- Is the low dollar enough to make US exports so competitive that they can support aggregate demand in the US to push production high enough until increased productivity can't take care of demand anymore and you need to hire people back (who will then create demand themselves)?
- Is the market correct in viewing the higher productivity as positive?
A more detailed understanding of the literature on the real business cycle coudl certianly be useful.
Thursday, October 29, 2009
Should information about the past still matter to equity prices today?
Over the past two days the equity markets have taken a real beating. The S&P 500 has broken its trendline since March.

Then today the quarterly GDP number came out, and it was 3.5% annualized, when the survey was 3.3%. The market jumped on that news.

My colleague sent this Bloomberg to me:
geez...i guess people don't care that 3Q GDP already happened - not about the future....
To some extent he's right. Whatever happened in the past happened in the past and is not information about the future. And for asset valuation it is, after all, the future stream of cash flows that matters. It's not: "How well did this company do in the past" but "How well is this company going to do in the future" that should inform how much you should be willing to pay for a piece of it (i.e. a stock.)
However, I'm not sure if I totally agree. Here's a theory of why the GDP release today maybe should matter to the equity markets.
From quarter to quarter we aren't actually sure what economic activity is. We have a sense from various data releases and anecdotal evidence but we rely on official statistics and ultimately on the GDP number to aggregate all these statistics and anecdotal evidence and tell us what economic activity actually was (to the best extend possible--of course GDP is also just a representation of reality and we can't ever truly know economic activity but this is not a philosophy class.)
So what if the entire time the market assumed that economic activity was something and that we are at point A in the diagram below when in reality we are at point B.
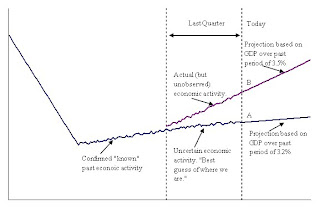 That would probably inform your estimate of the future. Even if the economic growth number stayed the same, past, higher economic activity would mean higher profits today and in the future.
So is it possible that to that extent the GDP number today matters to market valuation even though it is backward looking and only tells us about what happened in the past?
Monday, October 26, 2009
Portfolio Management
If you, like many asset managers, manage against a benchmark then you have some sort of benchmark index, let's say the Dow Jones Index or the S&P 500 that you try to beat. So what you do is that you mimic the composition of the index (to a bigger or smaller extent) and then you go "overweight" or "underweight" certain stocks or industries or countries. So you'll say: "I think that in the current recession consumer staple stocks will do better than consumer discretionary stocks because in a recession people will trim down on their discretionary spending and stick with whatever is necessary." And if CS stocks are 20% of the index you might allocate 30% or your portfolio there. Conversely, if CD stocks are 15% of the index you might go underweight to 10%, i.e. "go underweight 5%."
If you wanted to, you could put that on a scatterplot like the following:
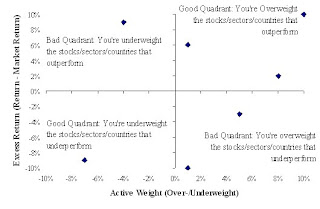
On the horizontal axis would be how much you are overweight or underweight (for let's say a certain sector) and on the vertical axis would be how much that sector out- or underperformed the broader market. You'd have a point for each time period, like for each month or quarter or over whatever investment horizon you make your decisions.
Your optimal graph would look something like this, where most of the time you are overweightin the sectors that outperform and underweight in the sectors that underperform.
 If, however, you're an unnamed asset management firm then your graph looks like this:
 I have no idea how that stacks up against other asset managers but there are essentially two possibilities:
a) This firm is not that great at selecting the right assets (and outperformance comes from something else, e.g. liquidating when the market tanks, luck, who knows?)
b) Everyone is like this corroborating a theory that asset prices operate in a very complex system and that nobody really has the means to make good educated guesses which assets are more likely to outperform.
c) Everyone is like this but the picture is misleading and even a small margin of better bets vs. worse bets leads to outperformance over the long-run.
Wednesday, October 21, 2009

Wednesday, October 14, 2009
The Uncanny Valley
Wow, I found this super-interesting. Apparently, humans
"like to study other human faces, and they also can enjoy scrutinizing countenances that clearly are not human, such as a doll's or a cartoon figure's. But when an image falls in between -- close to human but clearly not -- it causes a feeling of revulsion. [...]
Despite the widespread acknowledgement of the uncanny valley as a valid phenomenon, there are no clear explanations for it, Ghazanfar said. One theory suggests that it is the outcome of a "disgust response" mechanism that allows humans to avoid disease. Another idea holds that the phenomenon is an indicator of humanity's highly evolved face processing abilities. Some have suggested the corpse-like appearance of some images elicits an innate fear of death. Still others have posited that the response illustrates what is perceived as a threat to human identity."
The same is apparently true with monkeys. How interesting. This was via Marginal Revolution.
Earnings season again
So it seems like the easiest way to keep up-to-date on a blog is to just go back to older post and see how things look now. For the past few weeks I have been very unconvinced that the rally in the equity markets is on solid footing. Here are some arguments, not particularly well thought-out:
But the stock market has rallied in the face of all of this, up over 63% since the low in March and 20% since the beginning of the year. Last earnings season was very positive since a lot of companies beat analysts' earnings estimates through a combination of cost-cutting, accountinggimmicks corrections (i.e. "extraordinary items"), and a genuine bottom coming in underneath plummeting sales. But, as we all know, cost-cutting is not sustainable over the long run. You can only trim so much fat before you're cutting into flesh and only so much flesh before you hit the bone. Similarly you can't keep having "infrequent" or "extraordinary" items. Once you have them twice, in a row they're not really all that "extraordinary" or "infrequent" anymore.
Since then I have essentially said that this next earnings season will give guidance and show that the market has gotten ahead of itself. Companies will disappoint and the market will correct. Except, an astounding 78% of the S&P 500 companies have beaten consensus estimates so far. What the hell? No wonder the Dow is close to breaking 10,000. Argh!
- Yes, unemployment is a lagging indicator but two-thirds of the US GDP (as you'll remember form Econ 101 GDP=C+I+G+[X-IM]) comes from private consumption (C.) While government support for consumption (e.g. cash for clunkers) supports/supported consumption these programs run out. With close t0 10% unemployment and only a slowing in the new unemployment numbers at the margin (i.e. still more lay-offs every week, albeit fewer) I just don't see where those 2/3 of GDP are supposed to come from.
- It's not just unemployment. People are also saving more.
 The question here is, of course, what a new equilibrium savings rate would be. Right in the heart of the credit crisis we saw it jump back up to 6 percent, which is unlikely in the long run. But maybe something around 4 percent? I mean, that's still 100% more than in 2005 or 2006. Not only are people out of jobs the little money that they do earn they also don't spend.
 - There is a very scary housing picture. Mortgages are in default and haven't even hit the foreclosure stage yet b/c... well, what does a bank want with a house? The mortgages in default now are increasingly of higher quality. It's not just the sub-prime people anymore. The ratio of going into default once a mortgage payment is 30, 60, 90 days overdue keeps rising, and the rate of people staying out of default once they have done a reworking of the terms of the mortgage keeps declining. So the housing picture could still get a lot worse. People won't have as much equity and banks similarly won't have a lot of collateral they can rely on.
- Banks are rationing credit. The credit markets aren't frozen but we're seeing a lot of pruning at the lower end of the credit spectrum.
- Currently there is a lot of G (government spending.) That's going to end sometime.

- Export might pick up, seeing that the USD is extremely weak.
- ummmm.....
But the stock market has rallied in the face of all of this, up over 63% since the low in March and 20% since the beginning of the year. Last earnings season was very positive since a lot of companies beat analysts' earnings estimates through a combination of cost-cutting, accounting
Since then I have essentially said that this next earnings season will give guidance and show that the market has gotten ahead of itself. Companies will disappoint and the market will correct. Except, an astounding 78% of the S&P 500 companies have beaten consensus estimates so far. What the hell? No wonder the Dow is close to breaking 10,000. Argh!
Finding the odd one.... nevermind. there is no odd-one out anymore
A little while ago I was looking at the co-movement of local equity markets and currency markets. I singled out Mexico and Korea as being "susceptible to repricing" and asked "What do the currency markets know that the equity markets don't yet reflect (or vice-versa)?" Turns out it seems that it's more vice-versa, at least in Mexico's case.
Mexico had looked like this:
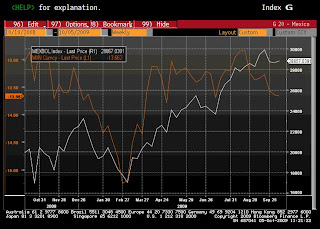 Now it looks like this:
 The equity markets kept grinding higher and the Peso, after its sell-off has followed suit.
Here is what Korea looked like:
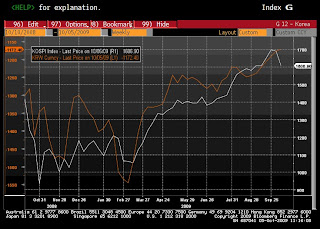 Here's what it looks like now:
 Here the Won had kept appreciating while the equity markets sold off. Now they're back (although Korea is the worst-performing market in the MSCI Emerging Markets month-to-date.)
Maybe the way to play this sort of thing is through a relative value trade.
The NY Times Needs to get a copyreader
This is from an article that I just came across on the NYT via the Huffington Post (from, like, a year ago):
A little more than a month later, the funds, filled with some of the most explosive and high-risk securities available, imploded, evaporating $1.6 billion of investor assets and setting off a financial chain reaction that has rattled global markets, caused more than $350 billion in write-downs, cost a number of executives their jobs and culminated in the demise of Bear Stearns itself.
The Times needs a copy-reader. "[T]he funds, filled with some of the most explosive [...] securities available, imploded"? Imploding is the exact opposite of exploding. Unless, of course, the securities were highly explosive but failed to deliver and the whole thing just imploded instead.
Ahhh.... the joys of stickling on a Wednesday morning....
Tuesday, October 13, 2009
Dani Rodrik does it again
Dani Rodrik's latest Project Syndicate post is fantastic. Among the many very good passages is this one:
"Financial markets discipline governments. This is one of the most commonly stated benefits of financial markets, yet the claim is patently false. When markets are in a euphoric state, they are in no position to exert discipline on any borrower, let alone a government with a reasonable credit rating. If in doubt, ask scores of emerging-market governments that had no difficulty borrowing in international markets, typically in the run-up to an eventual payments crisis.
"Financial markets discipline governments. This is one of the most commonly stated benefits of financial markets, yet the claim is patently false. When markets are in a euphoric state, they are in no position to exert discipline on any borrower, let alone a government with a reasonable credit rating. If in doubt, ask scores of emerging-market governments that had no difficulty borrowing in international markets, typically in the run-up to an eventual payments crisis.
In many of these cases – Turkey during the 1990’s is a good example – financial markets enabled irresponsible governments to embark on unsustainable borrowing sprees. When “market discipline” comes, it is usually too late, too severe, and applied indiscriminately."[bold emphasis mine]
I whole-heartedly agree. As to his larger point: I wonder what appointing a finance skeptic to head the Fed would look like? Who would he have in mind?
Monday, October 5, 2009
Find the odd one out
I just looked at some of the major EM local stock markets versus their currencies. In general I would expect them to be moving together quite well. After all usually EM stock markets and EM currencies are both seen as risk assets and when it's risk on they both appreciate and when it's risk off they both depreciate, not to mention that you need local currency to buy local stock.
The data bear out this relationship for the most part. Bovespa, for example shows strong co-movement with the Real.


The data bear out this relationship for the most part. Bovespa, for example shows strong co-movement with the Real.

The Sensex is a little less well correlated, probably b/c of investment regulations.


In Russia we see a little bit of a divergence in June but since then the two have recoupled.


Here are some of the biggest other markets. Turkey:


Taiwan:


Thailand:


South Africa:


They all seem to price in similar things for the respective country. However, in Mexico we've seen a decisive break downwards at the end of August while the market, probably on the back of US strength, has mostly ground higher with just a recent correction.

And in Korea the market has sold off while the Won has kept appreciating.


To my eye the last two markets seem susceptible to repricing. What do the currency markets know that the equity markets don't yet reflect (or vice-versa)?
Monday, September 28, 2009
Communism
I just saw Michael Moore on CNBC where they talked about his new Film "Capitalism: A Love Story." He answered some question by saying: "Capitalism is a system that guarantees--and these are the statistics--that the top 1% of the population have more wealth than the bottom 95% combined." I think that was verbatim. The CNBC talking heads came back at him with these kinds of questions: "So are you saying that there should be no losers?" And in particular they started asking about the system of capitalism theoretically. And then they argued about the theory of capitalism. And it makes me think that in general it seems to me--and this might be false--that we, as a society, are pretty willing to discuss capitalism as a theory and how theoretically it's the superior system, how, sure, market forces might need taming or direction but that in general "the invisible hand" allocates resources efficiently. This is a theorietical construct. There is, as we all know, no invisible hand. It's just a metaphore Adam Smith came up with.
So why??? are we perfectly willing to discuss and defend capitalism on a theoretical level while ignoring the outcomes or, if not ignoring, viewing them as deviations from the norm, noise, dirt that muddles the theory a little but in general the theory holds... why are we willing to do that when any time someone would want to seriously discuss socialism or communism the next sentence spoken is: "Communism is a great theory but it doesn't work in practice." Sure, the failure of communist experiments have been huge but the failures of capitalism like e.g. the past crisis (or the fact that wealth is so unevenly distributed around the world or even around this country and that millions die of hunger and disease, every year) have been nothing to sneeze at either.
Notice that I am not advocating communism or socialism (although I am hazy on what exactly socialism is--I am in favor of a socially conscious and responsible capitalist approach.) I am merely wondering why, as a society, we are fine arguing on the basis of theory, ignoring the unfavorable outcomes in capitalism's case but are not willing to do so when talking about communism.
Subscribe to:
Posts (Atom)